Stocks Crypto and Personal Finance
Why Returns Displayed in Asset Management Apps Are Calculated Differently From Actual Account Returns
 0
0
 0
0
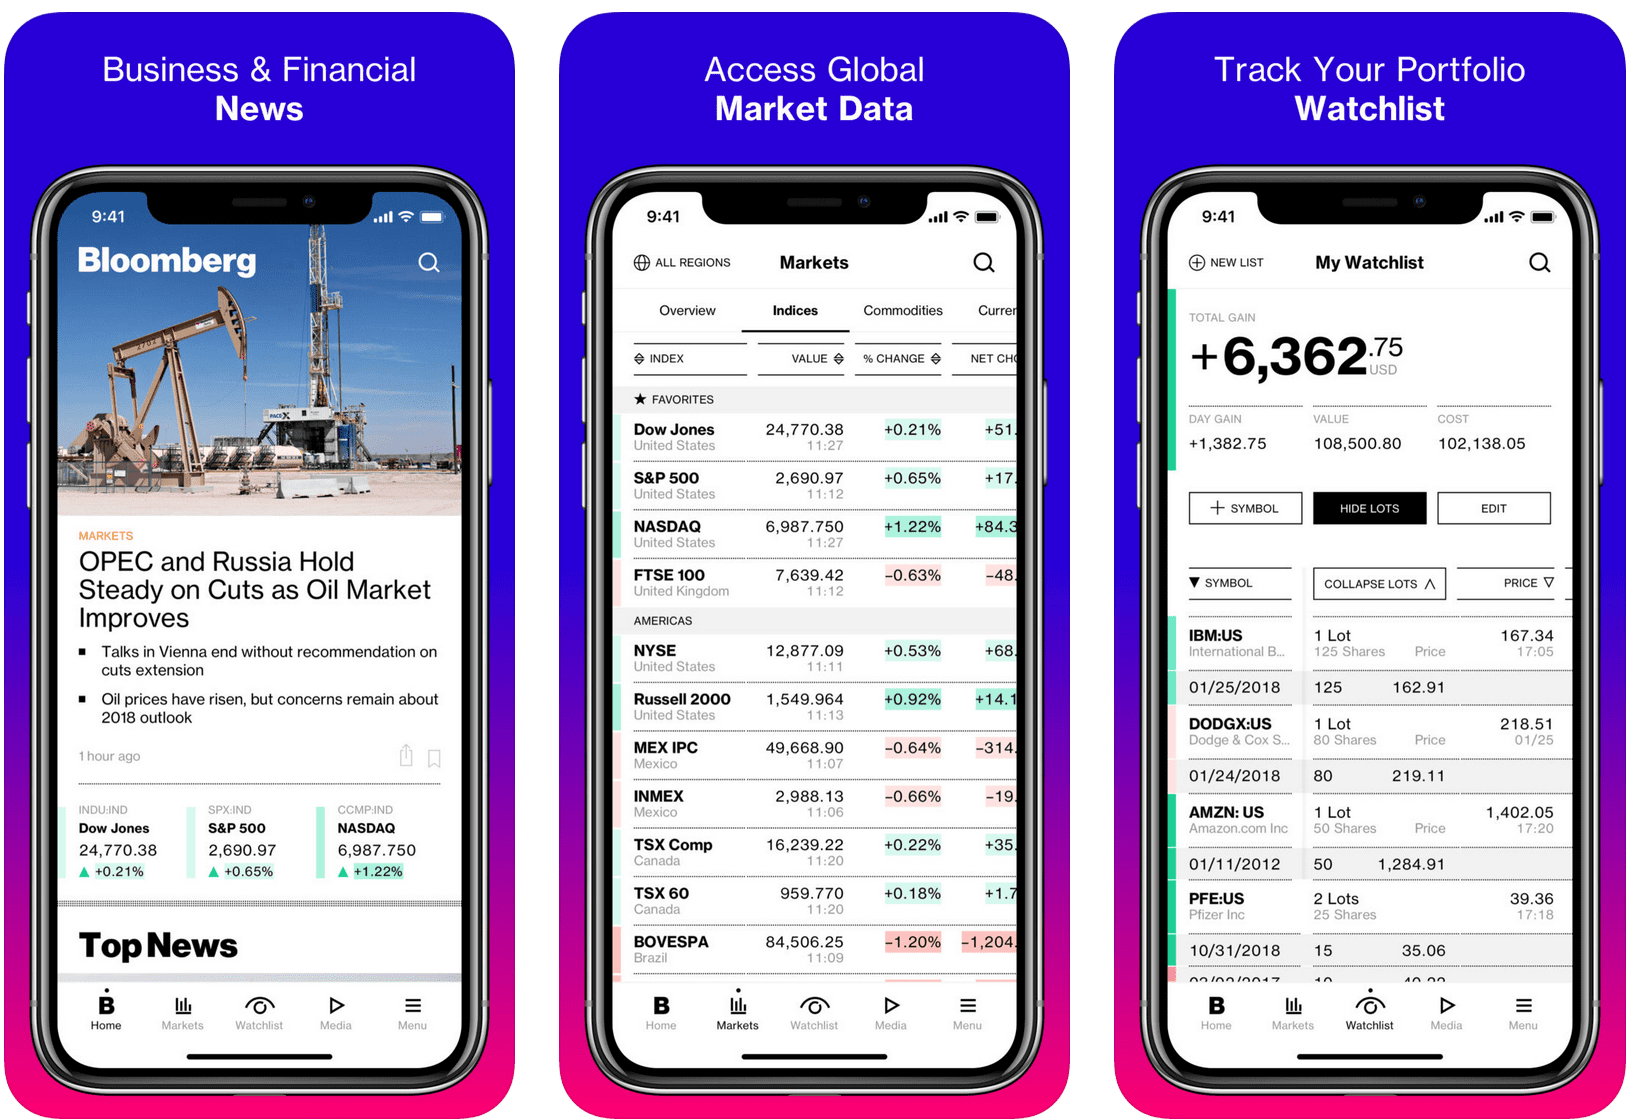
Logging into a personal finance or wealth-tracking app often reveals a satisfying green number: a “+12% total return” on your portfolio. However, when you log into your actual bank or brokerage account and count the physical cash you deposited versus what you can withdraw today, the real-world math tells a different story. You might discover you have barely broken even or are actually showing a net financial loss.
This confusing gap is not an error in your banking records or a bug in the app’s software. It is caused by two fundamentally different mathematical formulas used to measure investment performance: Time-Weighted Return (TWR) and Money-Weighted Return (MWR). Understanding why fintech apps default to TWR, how cash flow timing alters your real wallet growth, and how to calculate your own personal XIRR rate ensures you make rational decisions when buying, selling, or rebalancing assets.
The two math formulas that create conflicting return numbers
To solve the discrepancy on your screen, you must understand how financial algorithms treat the timing of your cash deposits and withdrawals.
Time-weighted return for evaluating fund manager skill
Most fintech apps and wealth management dashboards default to Time-Weighted Return (TWR). The primary objective of TWR is to isolate the pure performance of the underlying assets by neutralizing the impact of player deposits and withdrawals.
TWR breaks your investment timeline into separate sub-periods whenever a cash flow occurs, calculates the growth rate for each sub-period, and then multiplies them together. This formula evaluates the fund manager’s skill or the asset’s organic growth. Fintech apps prefer TWR because it displays an objective asset score: if an index fund grew by 10% over three years, TWR accurately reports +10%, regardless of whether you deposited money at the absolute bottom or the absolute peak.
Money-weighted return for measuring actual wallet growth
In contrast, your bank account and physical wallet operate strictly on Money-Weighted Return (MWR), commonly calculated as the Internal Rate of Return (IRR). MWR factors in the exact date and dollar amount of every single cash deposit and withdrawal you make.
Timing changes everything in MWR math. For example, if you invest $1,000 in an ETF and it rises 50%, your portfolio is worth $1,500. Thrilled by this gain, you deposit an additional $10,000 right at the market peak. The next week, the market suffers a 20% crash.
Because your second, much larger deposit bore the full brunt of the 20% drop ($11,500 drops to $9,200), you have lost $1,800 of real cash compared to your total $11,000 principal. Your personal MWR is negative. However, the app’s TWR calculation might still show a positive return because it gives equal weight to the initial 50% gain. TWR tells you how the asset performed; MWR tells you how your personal bank account performed.
A decision guide for using TWR versus XIRR in investment choices
To determine which return calculation you should use when making specific portfolio decisions, refer to this operational decision guide:
| What you are trying to evaluate | Correct formula to use | How it handles deposits & withdrawals | Actionable decision rule |
| Fund manager or ETF performance | Time-Weighted Return (TWR) | Removes cash flows entirely to show pure asset growth. | Use this number to decide if an ETF strategy or fund manager is performing well. |
| Personal cash flow & deposit timing | Money-Weighted Return (MWR / XIRR) | Factors in the exact date and size of every deposit/withdrawal. | Use this number to evaluate if your market entry/exit timing made or lost real money. |
| After-tax cash available for spending | Net Realized Return (After Tax/Fees) | Subtracts management fees, FX costs, and dividend taxes. | Use this number when planning real-world purchases, retirement spending, or rebalancing. |
Hidden distortions from uninvested dividends and management fees
Beyond the core math formulas, fintech apps introduce secondary calculation variables that further distort displayed performance numbers.
Cash dividend floats vs. automatic reinvestment
How an app handles cash dividends creates artificial performance lags. When a stock or ETF pays a cash dividend, some wealth apps add that payout directly to your portfolio balance and factor it into the return calculation immediately.
Other apps hold cash dividends in an uninvested “cash sweep” account. If the app’s main performance screen calculates returns based strictly on active invested equity rather than total account value, your displayed return will look lower than your actual net worth growth until that idle cash is manually deployed back into buying shares.
Gross return displays that hide advisory and trading fees
Fintech apps frequently display Gross Return—the performance of the assets before accounting for operational friction.
In the real world, advisory fees, annual expense ratios (deducted continuously by fund managers), and foreign exchange (FX) conversion spreads chip away at your capital. If an app displays a +8% gross return on an international fund, but you paid a 1% management fee and a 1.5% currency conversion spread, your actual net return is only +5.5%. Always verify whether your app displays gross performance or net-of-fee performance.
Practical steps to calculate your true personal return in Google Sheets
Instead of guessing whether your app is giving you an accurate personal return, you can calculate your exact Money-Weighted Return in under two minutes using a standard spreadsheet.
The =XIRR spreadsheet formula setup for exact returns
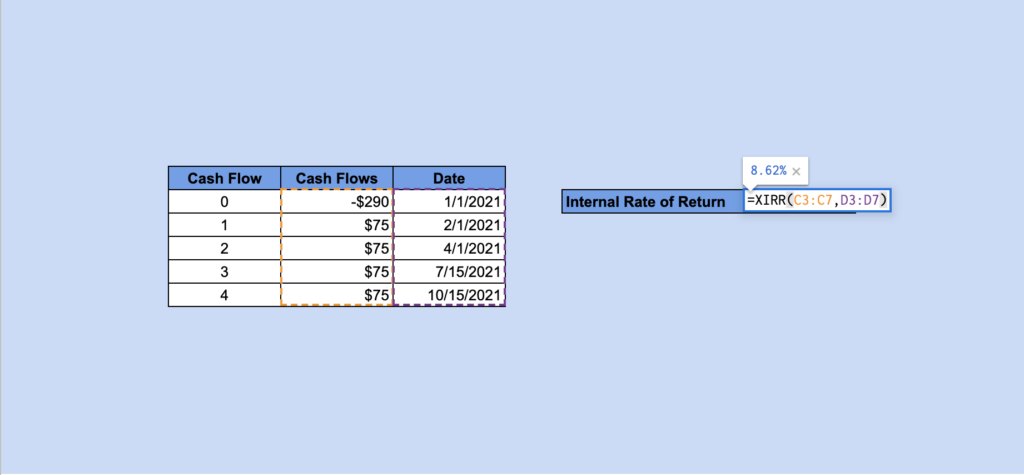
The =XIRR function in Google Sheets or Microsoft Excel calculates the exact annualized internal rate of return for irregular cash flows.
To build your personal return calculator:
- Open a blank Google Sheet.
- In Column A, enter the exact dates of every deposit, withdrawal, and today’s date.
- In Column B, enter the corresponding cash amounts. Enter deposits (money leaving your bank account into the portfolio) as negative numbers (e.g., -1000). Enter withdrawals as positive numbers.
- On the final row (today’s date), enter your current total portfolio value as a positive number (representing what you would receive if you liquidated today).
- In an empty cell, type: =XIRR(B1:B10, A1:A10).
The resulting percentage is your true, unvarnished personal annual rate of return, accounting for every single dollar and deposit date.
Decision rules before rebalancing or selling assets
Once you have both numbers, apply clear decision rules to manage your portfolio rationally:
- When evaluating the asset: If the app’s TWR is beating its benchmark (e.g., the S&P 500 index), keep holding the asset. The strategy is working.
- When evaluating your timing: If your personal XIRR is significantly lower than the app’s TWR, do not panic-sell the asset. A low XIRR simply means you deposited large sums near market peaks. Keep holding, avoid panic selling during dips, and use dollar-cost averaging to smooth out future entry points.


