NYC Food Film Festival

Stocks Crypto and Personal Finance

Return Calculation, Fee Treatment, and Data Refresh Differences Across Asset Management Apps

Steven Hernandez
Return Calculation, Fee Treatment, and Data Refresh Differences Across Asset Management Apps
0 0
Read Time:11 Minute, 10 Second

Two asset management apps can connect to the same brokerage account and still display different return percentages. One may show a portfolio gain of 11%, another 8%, while the brokerage statement appears to support a third figure. The difference does not necessarily mean that one app has calculated the account incorrectly.

Return figures depend on the calculation method, cash-flow timing, treatment of dividends and fees, valuation prices, foreign exchange rates, and the point at which market data is refreshed. Professional performance standards emphasize consistent calculation inputs and methodologies precisely because changing those assumptions can change the reported result.

The useful question is therefore not simply whether an app’s return percentage is correct. Users need to know what that percentage measures, what has been included, what valuation time was used, and whether the figure suits the purpose for which they are checking the account.

Return Calculation Methodologies

The first source of disagreement is the return formula itself.

A simple gain or loss percentage usually compares some form of investment gain with the amount invested. This can work reasonably well for a portfolio funded once and left untouched. It becomes harder to interpret when money is added or withdrawn frequently because the result depends heavily on how the application defines invested capital.

Consider an investor who deposits $10,000, allows the portfolio to rise to $11,000, and then adds another $20,000. A calculation that simply compares the current account value with total net deposits gives substantial weight to the new $20,000 even though it was not invested during the earlier gain.

Time-weighted return, or TWR, approaches the problem differently. The investment period is divided around external cash flows, and the returns for those periods are geometrically linked. The purpose is to reduce the effect that the investor’s deposits and withdrawals have on the reported investment performance. The Global Investment Performance Standards rely heavily on time-weighted returns for performance comparison and require appropriate treatment of external cash flows.

Money-weighted return, or MWR, answers another question. It gives greater influence to periods during which more of the investor’s capital was actually invested. CFA Institute materials distinguish money-weighted and time-weighted return as separate performance measures with different uses.

The difference becomes obvious when deposits are large.

Suppose a small portfolio rises sharply during the first six months. The investor then deposits a much larger amount just before the market falls. TWR can remain relatively strong because it evaluates the investment periods without allowing the large deposit to dominate the earlier result. MWR may be much lower because most of the investor’s actual money was exposed during the decline.

Neither figure is automatically wrong.

TWR is generally more useful when asking, “How did the investment strategy perform independently of my deposit timing?” MWR is more useful when asking, “What return did my own money experience considering when I added or removed capital?”

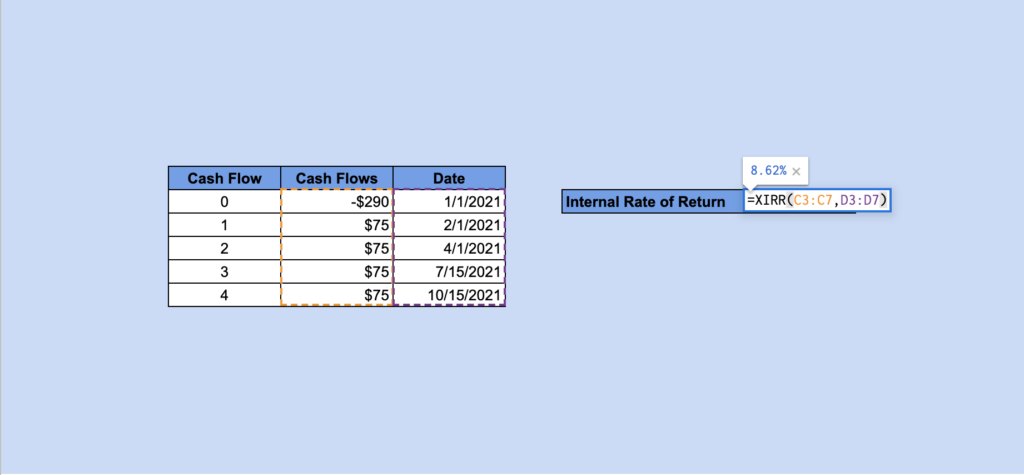
For irregular personal cash flows, Excel’s XIRR function calculates an internal rate of return using both the cash-flow amounts and their actual dates. Microsoft specifically describes XIRR as an internal-rate-of-return calculation for cash flows that do not necessarily occur at regular intervals.

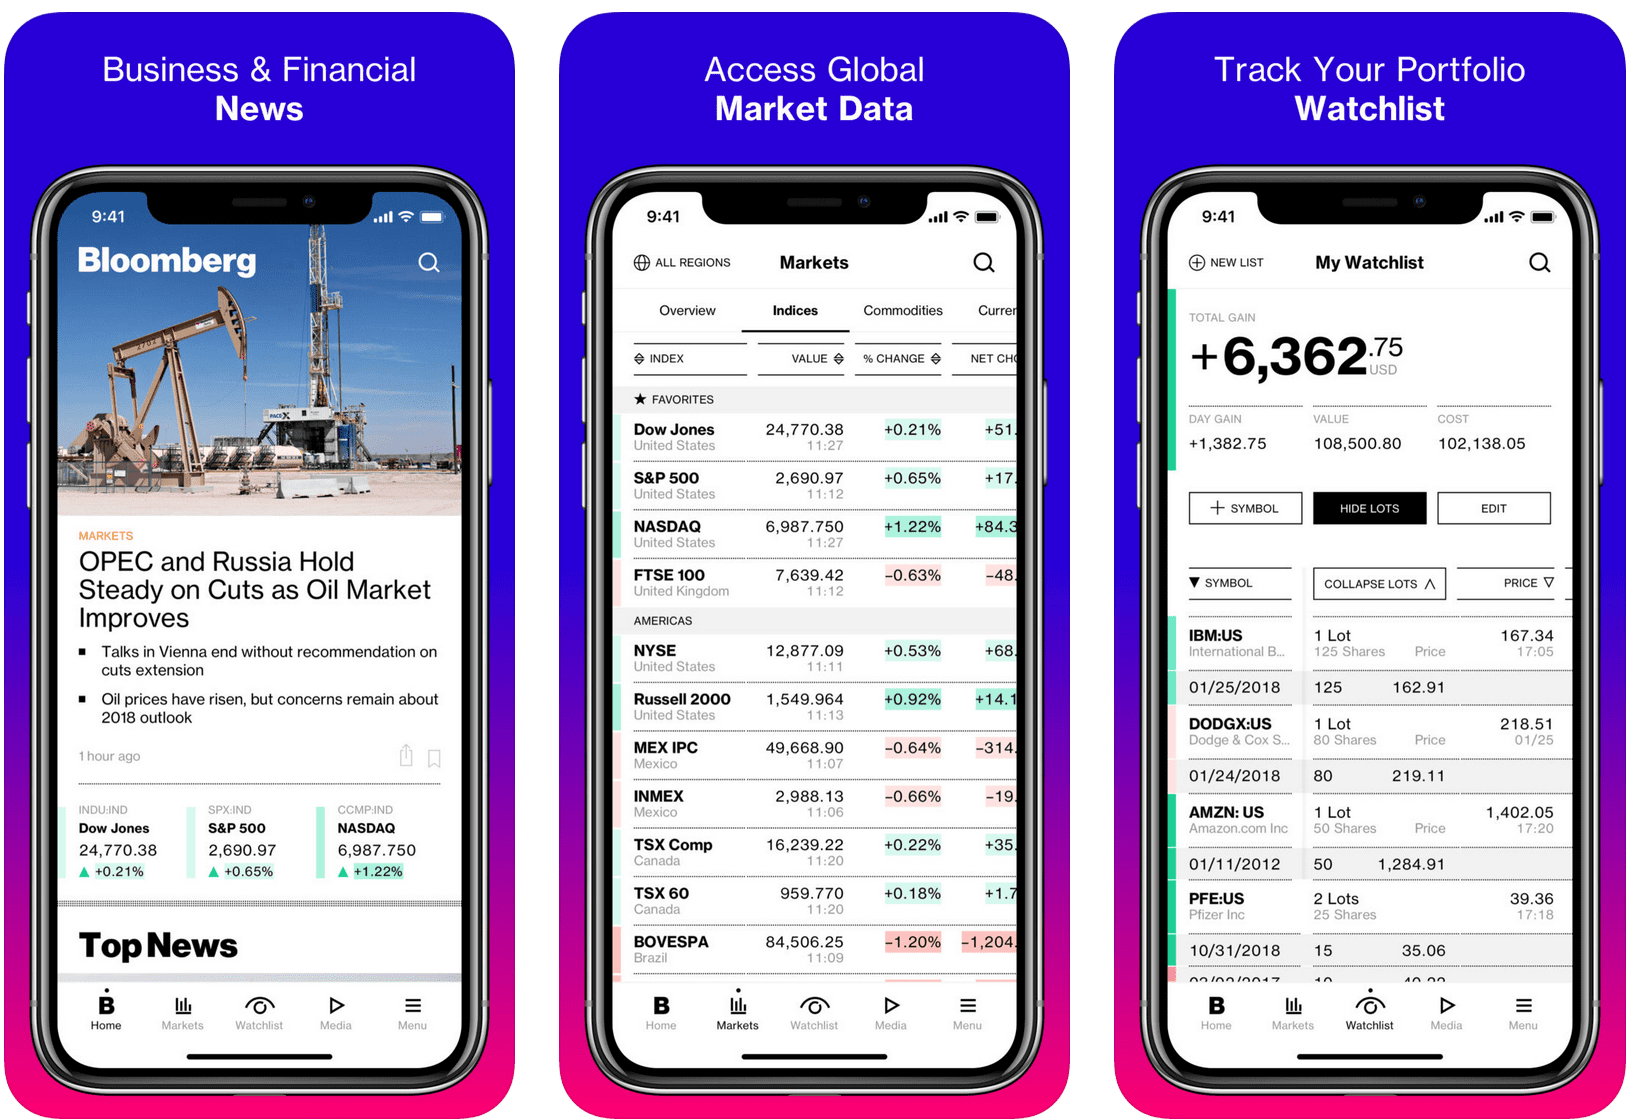
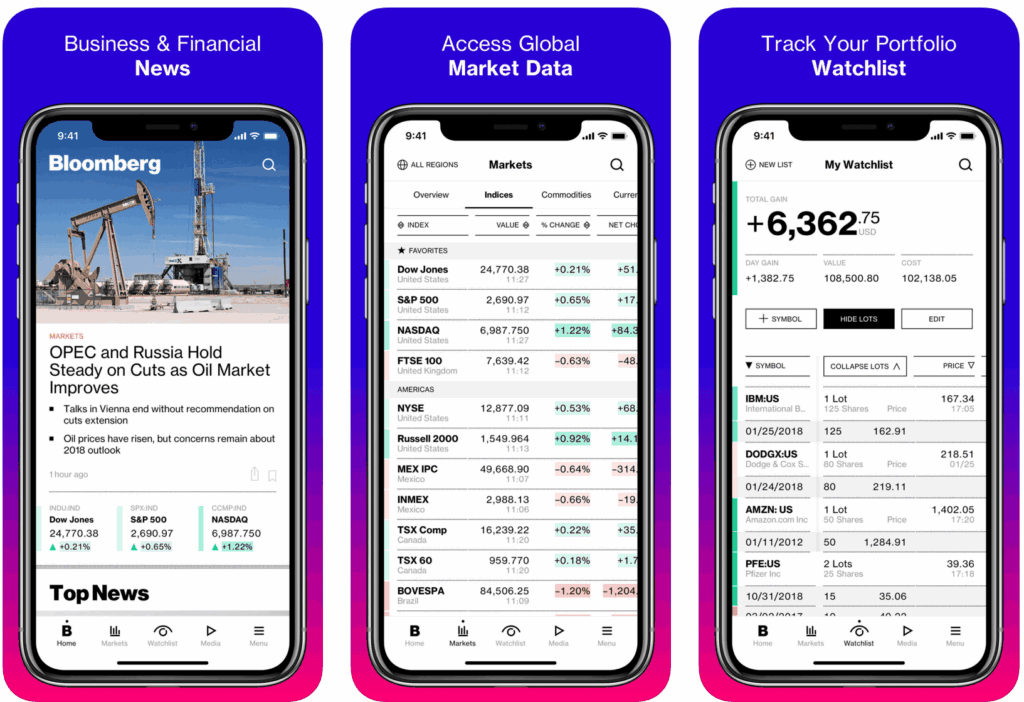
Comparison between the positive return displayed by an asset management app and the investor’s actual account value after all deposits and withdrawals are included.

Dividend, Interest, Fee, and Tax Treatment

Even applications using similar return formulas can disagree because they do not necessarily include the same cash flows. Dividends are a common example. One performance screen may show price appreciation only. Another may calculate total return by including dividends. A third may include the dividend only after the payment reaches the cash balance.

These approaches can produce visibly different results for dividend-paying stocks and ETFs. If a security falls from $100 to $97 after distributing $3 per share, a price-only view can appear to show a 3% decline even though the investor has also received cash. A total-return calculation treats the distribution as part of the investment outcome.

Cash interest creates a similar issue. Some asset-management applications include interest earned on uninvested cash in portfolio performance. Others classify cash separately and calculate investment return only for securities. Fees create another layer of variation.

The SEC notes that fees and expenses reduce investment returns and can include advisory fees, fund expenses, sales charges, transaction expenses, and other account costs. However, not every cost appears in an app in the same way.

A brokerage commission may appear as a direct cash deduction. An advisory fee may be withdrawn periodically from the account. An ETF expense ratio, by contrast, is generally reflected through the fund’s underlying expenses and therefore affects fund performance rather than appearing as a separate charge deducted by the portfolio app. Foreign exchange charges may appear explicitly or be incorporated into the conversion rate used for the transaction.

Taxes also require careful interpretation. A dividend may be displayed gross in one dataset but reach the brokerage account after withholding tax. If an aggregator records the announced dividend while the brokerage statement records only the net amount received, their cash and performance figures can temporarily or permanently differ.

For this reason, the user should look for terminology such as price return, total return, gross return, net return, realized gain, unrealized gain, and after-fee return instead of assuming that every green percentage represents the same calculation.

Foreign Exchange Rates and Valuation Prices

Foreign assets introduce two moving variables: the price of the investment and the exchange rate used to convert it into the account’s reporting currency.

Consider a U.S. stock held by an investor whose portfolio is displayed in Korean won.

The stock can remain unchanged in U.S. dollars while the account value rises in won because the dollar strengthens. The opposite can also occur: the stock can rise in dollars while won-based performance falls because the currency moves against the investor.

An app displaying local-currency returns may therefore combine investment performance and foreign exchange effects into one number.

Professional performance methodologies require consistent valuation policies. GIPS guidance states that investments should be valued at fair value when portfolio performance is calculated, and its example policies illustrate the use of specified foreign exchange sources and defined valuation times for foreign holdings.

Consumer apps do not necessarily use identical timestamps.

One application might use the latest available stock price and a near-real-time exchange rate. Another might use the previous market close for both. A brokerage statement may use its own official end-of-day valuation policy.

This difference becomes particularly noticeable around market opening and closing times.

For example, a Korean user can open an app during the Korean afternoon while the U.S. stock market is closed. The stock may still be valued using the previous U.S. closing price, while the KRW/USD exchange rate has already moved during the Korean trading day. The won value of the portfolio can therefore change even though the U.S. security itself has not traded.

The reverse situation can occur after the U.S. market opens. One app may immediately update the stock price while another waits for delayed data or the next synchronization cycle.

A proper comparison should therefore record four items together:

Valuation Item Information Needed
Security price Closing, delayed, or real-time
FX rate Rate source and application time
Reporting currency Native asset currency or converted portfolio currency
Valuation timestamp Exact date and time of displayed value

Without these four details, two apparently conflicting return figures may simply be measuring the portfolio at different moments.

Cumulative and Annualized Returns

Another frequent source of confusion is the difference between cumulative and annualized performance. Cumulative return measures the total percentage change over the entire displayed period. If an investment increases from $10,000 to $12,100 over two years without additional cash flows, the cumulative gain is 21%.

That does not mean the investment earned 21% per year. Annualized return converts multi-year performance into an equivalent compounded yearly rate. In this simple example, a two-year cumulative return of 21% corresponds to an annualized return of 10%, because two years of 10% compounding turns $10,000 into $12,100.

The distinction becomes increasingly important as the measurement period grows. SEC investor guidance for mutual-fund and ETF reports notes that performance tables use average annual total returns over periods such as one, five, and ten years. Investor.gov also notes that there are multiple methods for calculating annual rates of return.

An app displaying “+45% since inception” may therefore be showing cumulative performance, while another displaying “8.2% annualized” can be describing the same investment history in a different form. Users should also be cautious with very short periods. Annualizing a return achieved over only several weeks can produce a dramatic-looking percentage that assumes the short-term rate could continue for an entire year. That number is mathematically useful in some comparisons but does not mean the portfolio actually earned that annual amount.

Data Refresh Cycles and Closed-Market Days

Asset management apps also differ in how frequently they synchronize prices, balances, transactions, and exchange rates.

A brokerage application may receive trades immediately because it executed them. A third-party asset aggregator might receive updated account information periodically through an external connection.

As a result, a security can appear sold in the brokerage account while remaining in the asset-management app until the next synchronization.

The same problem affects cash.

A dividend can appear in the brokerage cash balance before the portfolio app imports it. A recent deposit may be visible at the broker but not yet reflected in the app’s return denominator. During that period, the return percentage can appear temporarily exaggerated or depressed.

Market holidays create another useful test.

If the U.S. market is closed, the last available U.S. stock price may remain unchanged. Korean markets, bond markets, currency markets, or other assets in the same account may still update. The total portfolio value can therefore move even though one group of securities is using an older valuation date.

Applications that show only a percentage without an as-of time make these differences harder to identify.

A more trustworthy performance screen should make it possible to determine whether prices are real-time, delayed, previous-close, or based on the latest synchronized account data.

Google Sheets using the XIRR function with dated positive and negative cash flows to calculate an investor’s personal money-weighted return.

Brokerage Statement Reconciliation

When an app’s result appears inconsistent, the most useful comparison is not another app. It is the underlying brokerage transaction history and official account statement. The SEC advises investors to examine account statements and trade confirmations carefully and verify information such as transaction date, price, and security details. Start by choosing one common valuation date.

Do not compare an app at 2:00 p.m. today with a brokerage statement produced at the end of the previous month. First reproduce the account as of the statement date. Then compare beginning cash, deposits, withdrawals, purchases, sales, dividends, interest, fees, taxes, ending cash, and securities held.

For foreign assets, confirm the reporting currency and exchange-rate convention. If the statement reports a U.S. stock in dollars while the app converts the entire portfolio into won, the figures cannot be compared directly until they are placed in the same currency. The calculation method should be matched as well.

If the app reports TWR and the spreadsheet calculation uses XIRR, identical percentages should not be expected. The correct check is whether each calculation is internally consistent with its stated methodology.

A practical reconciliation table can use the following structure:

Item Asset App Brokerage Statement Difference to Investigate
Opening value Valuation date
Deposits Missing or delayed sync
Withdrawals Cash-flow classification
Dividends/interest Gross or net treatment
Trading fees Included or excluded
Taxes Withholding treatment
Closing securities value Price timestamp
Cash balance Pending transactions
FX conversion Rate and timestamp
Displayed return Calculation methodology

This process usually reveals the source of a discrepancy more quickly than trying to reverse-engineer the percentage from the final account balance alone.

Return Metrics by Usage Purpose

Different numbers are useful for different decisions. For investment strategy evaluation, a time-weighted return is often more informative because deposits and withdrawals made by the investor have less influence on the measurement. It can also be compared more appropriately with a benchmark when the calculation period, return type, and currency are aligned. GIPS guidance emphasizes matching return types, currencies, and measurement periods when performance and benchmarks are compared.

For personal investment experience, money-weighted return is useful because it incorporates when the investor actually committed capital. For current asset status, the important figures are usually holdings, current prices, cash, liabilities, and total account value rather than a historical performance percentage.

For cash available to withdraw, neither TWR nor MWR is sufficient. The user needs the brokerage’s actual cash balance, settlement status, taxes, fees, and withdrawal restrictions. For tax reporting, an asset-management app should not replace the official records provided by the brokerage or relevant financial institution.

The strongest asset-management app is therefore not necessarily the one showing the most detailed chart. It is the one that explains what its return represents. Before relying on a displayed percentage, users should be able to identify the calculation method, dividend and interest treatment, inclusion or exclusion of fees and taxes, valuation-price source, exchange-rate timing, reporting currency, cumulative or annualized format, and last data-update time.

Once those conditions are known, differences between applications become much easier to interpret. A 9% return and a 12% return can both be mathematically valid while answering different questions. The important task is matching the number to the decision being made rather than assuming every portfolio return is supposed to be identical.

Happy
Happy
0 %
Sad
Sad
0 %
Excited
Excited
0 %
Sleepy
Sleepy
0 %
Angry
Angry
0 %
Surprise
Surprise
0 %